

Writing this commentary from the third week of January, it feels like we could dust off some older blogs or commentaries to reuse because the pattern we saw play out in between Federal Reserve meetings throughout 2022 is happening once again. Through January 17th, the S&P 500 is up 4.0% [1] year-to-date.
International equities are performing even better. The MSCI EAFE Index and MSCI Emerging Markets Index have both returned 7.5% [2] so far this year. Interest rates across the US Treasury curve have fallen and the Barclays US Aggregate Bond Index has consequently rallied 2.6% [3] year-to-date.
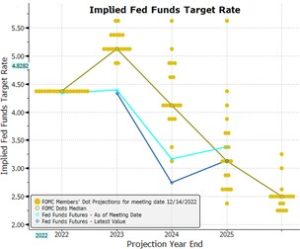
What gives? Following a difficult 2022 and a risk-off December, what changed when the clock struck midnight on January 1st and ushered in 2023? In our opinion, not a whole lot aside from the same rejection of Fed messaging that we saw multiple times last year in between FOMC meetings. At the December FOMC press conference, Fed Chair Jerome Powell insisted that rates were likely to top 5% and stay there without any rate cuts planned for 2023, barring unforeseen calamity. But the market has chosen to disagree, as shown in the two figures below [4]:

Source: Bloomberg
The first chart shows the current market forecast for the Fed Funds rate for the next year. It shows that the market expects the Fed Funds rate to peak below 5% at the May meeting and then it expects the Fed to begin cutting rates in July. The second chart takes a longer view and shows the market Fed Funds rate forecast against the Fed’s December dot plot out until 2026. The dot plot is the Fed’s own forecast, and each dot represents one Fed member. The light blue line is the market forecast at the time of the last Fed meeting and the darker blue line what the market was expecting as of Jan 11th. Despite the dot plot moving higher at that meeting and the Fed’s messaging growing more hawkish, the market forecast has actually fallen lower and the disconnect has grown.
Whether you believe the market forecasts or not, they matter a lot to shorter term market movements. Assets are almost always valued with the discount rate (or the risk-free rate) being a key input. As rate expectations fall, valuations across all asset classes should rise, which is what we have seen so far this year. Unfortunately, we still think the market is getting this one wrong and the January rally is likely to be short lived, for the following reasons:
- Fed credibility: After insisting that inflation was transitory throughout 2021 and then falling sharply behind the curve in 2022, the Fed is aware it has a credibility problem. We are choosing to take the Fed’s communications at face value in the absence of a compelling argument that we shouldn’t. At the December FOMC press conference, Chair Powell said that the labor market remained very strong, fighting inflation was the Fed’s top priority, and that rates would remain elevated as long as necessary to achieve price stability.
- The labor market: The labor market remains in disequilibrium despite some recent layoffs in the tech and financial sectors. Whatever the cause, death and disability among the working age population are on the rise and there is a structural shortage of workers as a result. The WHO estimates that there have been 14.8 million excess deaths globally in 2020 and 2021 [5] and insurers reported a 40% increase in working age deaths in 2021 [6]. The labor force participation rate remains stubbornly below the pre-pandemic norm at just 62.3% and the unemployment rate of 3.6% [7] is near multi-decade lows. A big enough slowdown will eventually cause unemployment to increase but it will take much longer than in prior slowdowns to do so given the missing workers.
- Inflation: It is true that we have seen some relief on the inflation front, but not nearly enough yet. Headline CPI fell from 9.1% in June 2022 to 6.5% in December 2022 [8] but is still well above the Fed’s 2% target. While the earlier drivers of inflation like durable goods and energy have started to turn negative, inflation in services is up 7.5% year-over-year in December, the highest since 1982. This is concerning because services inflation is more closely tied to wages and tends to be stickier. Inflation also remains vulnerable to upside surprises if energy or commodity prices increase as China reopens. The market expects inflation to return to the 2% level by year-end, which we think is unlikely given longer term inflationary forces like the trend towards re-shoring/” friend-shoring”, climate change and the worker shortage discussed above.
All of this has been a long-winded way to say that our view hasn’t changed much since our last commentary. We aren’t ruling out the possibility that the market is correct, and we (and the Fed) are wrong, but we just don’t see the evidence to support that yet. In our view, the Fed will only pause or pivot before inflation is fully under control if “something breaks” and rate hikes push us into a hard landing or worse, hardly a good situation for risk assets. So, we’re remaining defensive with our exposure to equities and credit, which will face challenges in either scenario. We are also maintaining our underweight to duration (ie interest rate risk) in our bond portfolios because we don’t believe the full extent of rate hikes are priced in. We’re closely monitoring the inflation and employment situation, as well as messaging from the Fed, for any indications that it is time to update our rate outlook.
Market Update
Economic and market conditions remained challenging into the fourth quarter of 2022, concluding a year dominated by surging inflation, Russia’s brutal invasion of Ukraine, and aggressive monetary tightening. Both stocks and bonds suffered large losses, making 2022 the worst year for a balanced portfolio since 2008 with the average 60/40 portfolio down 16.0% [9] and the S&P 500 down 18.1%. [10] Energy stocks were the year’s clear winners with the sector up 64.3% [11] as rising oil and natural gas prices sparked by OPEC production cuts and ripples from Russia’s attack on Ukraine contributed to big gains for the sector. Defensive sectors such as consumer staples (-0.80%), healthcare (-2.04%), utilities (1.47%) broadly lived up to their name, protecting against some of the year’s steep declines [12].
The S&P Midcap 400 outperformed the large cap S&P 500 by about 5% and the small cap Russell 2000 lagged the S&P 500 by about 2%. Generally, smaller cap stocks tend to be more volatile, both on the upside and downside, than larger cap stocks. So, the relative performance of mid and smaller cap stocks this year was strong given the large drop in the market that occurred. One likely reason for this was the dollar’s strength, a bigger headwind for U.S. multinational companies because large cap stocks tend to have a bigger global footprint than smaller cap stocks.
It was a terrible 12-months for growth stocks, which had their worst calendar year in over a decade as value took back the leadership role. Prior to last year, the growth index had consistently outperformed the value index since 2008. In 2020 and 2021, tech stocks drove big gains pumping up growth and leading to some of the widest performance gaps for style investing on record. But these valuations quickly evaporated in the face of rising interest rates. Growth oriented sectors such as technology (-27.7%) communication services (-37.6%) and consumer discretionary (-36.3%) performed worst this year with notable stock blowups in Amazon (-49%), Tesla (-68%), and Meta (-66%) [13].
Regionally, developed markets outperformed the US despite the stronger dollar and impact of the war in Ukraine on Europe. The MSCI EAFE Index lost 13.9% compared to the S&P 500’s loss of 18.1% [14]. A milder winter and lower energy prices than had been expected boosted European returns in the fourth quarter. The MSCI Emerging Markets Index underperformed the US, losing 19.9% in 2022 [15], dragged down by an underperforming China but helped somewhat by outperformance from commodity-exporting Latin American countries.
The Fed’s aggressive interest-rate increases drove yields higher across the bond market, but especially among short-term bonds. The U.S. Treasury 10-year note climbed from 1.5% at the end of 2021 to a high of 4.25% for the year in October, its highest level since 2008, and finished the year at 3.8% [16]. The 2-year Treasury rose from just 0.7% at the beginning of the year to 4.3% at the end of 2022 [17]. This yield curve inversion can be a sign of investor pessimism about the economy, and persistent inversions like we saw last year almost always result in recession. Ultrashort bonds and floating-rate debt offered the only bright spots for bond investors. Ultrashort bonds were kept afloat by their very short maturities, which make them less sensitive to changes in interest rates. Overall, the Bloomberg US Aggregate Bond Index lost 13% in 2022, the worst performance since the inception of the index in 1976 [18].
________________________________________
[1] Total return, sourced from Bloomberg as of 1/17/2023[2] Total return, sourced from Bloomberg as of 1/17/2023
[3] Total return, sourced from Bloomberg as of 1/17/2023
[4] Bloomberg, accessed 1/18/2023
[5] The WHO estimates of excess mortality associated with the COVID-19 pandemic https://www.nature.com/articles/s41586-022-05522-2
[6] Insurance executive says death rates among working-age people up 40 percent https://www.wfyi.org/news/articles/insurance-death-rates-working-age-people-up-40-percent
[7] Bloomberg, as of December 2022
[8] Bloomberg, accessed 1/18/2023
[9] JPMorgan Q4 2022 Markets Perspective
[10] Total return, sourced from Morningstar Direct as of 1/17/2023
[11] Total return, sourced from Morningstar Direct as of 1/17/2023
[12] Total return, sourced from Morningstar Direct as of 1/17/2023
[13] Total return, sourced from Morningstar Direct as of 1/17/2023
[14] Total return, sourced from Bloomberg as of 1/17/2023
[15] Total return, sourced from Bloomberg as of 1/17/2023
[16] Bloomberg, accessed 1/8/2023
[17] Bloomberg, accessed 1/8/2023
[18] JPMorgan Q4 2022 Guide to the Markets
________________________________________
Gitterman Wealth Management, LLC dba Gitterman Asset Management. Services provided by Gitterman Asset Management are provided by Gitterman Wealth Management, LLC. All investment advisory services are offered solely through Gitterman Wealth Management, LLC an independent investment advisory firm registered with the SEC (CRD 153062). Associated persons of Gitterman Wealth Management, LLC are licensed with and offer securities through Vanderbilt Securities, LLC, member FINRA/SIPC, registered with MSRB (CRD 5953). Gitterman Wealth Management, LLC and Vanderbilt Securities, LLC are separate and distinct federally regulated entities. For more information see www.adviserinfo.sec.gov
The asset allocation of the model portfolios listed above are proprietary to and developed by GWM. Different types of investments and strategies involve varying degrees of risk, and there can be no assurance that any specific investment or strategy will be profitable. It is important for Investment Advisers to review with their clients their investment objectives, risk tolerance, time horizon, liquidity needs, and tax consequences related to the strategies in this presentation at least annually. Any investment involves a high degree of risk, including the risk that the entire amount invested may be lost. Many factors affect performance including changes in market condition, changes in interest rates, and market responses to economic, political and social developments.
This document does not constitute advice or a recommendation or offer to sell or a solicitation to deal in any security or financial product. It is provided for information purposes only and on the understanding that the recipient has sufficient knowledge and experience to be able to understand and make their own evaluation of the proposals and services described herein, any risks associated therewith and any related legal, tax, accounting or other material considerations. To the extent that the reader has any questions regarding the applicability of any specific issue discussed above to their specific portfolio or situation, prospective investors are encouraged to contact Gitterman Asset Management or consult with the professional advisor of their choosing.
Certain information contained herein has been obtained from third party sources and such information has not been independently verified by Gitterman. No representation, warranty, or undertaking, expressed or implied, is given to the accuracy or completeness of such information by Gitterman or any other person. While such sources are believed to be reliable, Gitterman does not assume any responsibility for the accuracy or completeness of such information. Gitterman does not undertake any obligation to update the information contained herein as of any future date.
Certain information contained herein constitutes “forward-looking statements,” which can be identified by the use of forward-looking terminology such as “may,” “will,” “should,” “expect,” “anticipate,” “project,” “estimate,” “intend,” “continue,” or “believe,” or the negatives thereof or other variations thereon or comparable terminology. Due to various risks and uncertainties, actual events, results or actual performance may differ materially from those reflected or contemplated in such forward-looking statements. Nothing contained herein may be relied upon as a guarantee, promise, assurance or a representation as to the future.
The information set forth herein is intended to be informational in nature and is not intended to be, and should not be construed as, investment advice. This information is accurate as of the above-listed date and it should not be assumed that it will remain the same over time. The views within this video do not necessarily reflect the views of Gitterman Asset Management and there is no guarantee that market trends discussed will continue to come to fruition.
PRIVILEGED AND CONFIDENTIAL: This communication, including attachments, is for the exclusive use of addressee and may contain proprietary, confidential or privileged information. It is your responsibility to ensure that all proprietary, confidential or privileged information contained here-in is masked/encrypted prior to any further distribution. If you are not the intended recipient, any use, copying, disclosure, dissemination or distribution is strictly prohibited. If you’re not the intended recipient, please notify the sender immediately by return email and delete this communication and destroy all copies.