

We are in an inflationary environment as the world adjusts to a post-lockdown world. Investors are therefore interested in knowing how their portfolios might perform in an inflationary world.
Quality stocks tend to fare well versus the broad market during inflationary times and paying attention to valuation alongside quality has delivered even better results. According to recent research from GMO, “in historic bouts of inflation… cheaper high-quality stocks beat the S&P 500 in 7 of the 8 inflationary periods.”¹
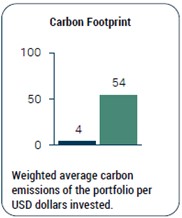
Quality companies are generally lower risk from an environmental impact perspective, owing to the asset-light nature of their businesses. As shown below, greenhouse gas (GHG) emissions, energy consumption, water use, and waste discarded are all significantly lower than the S&P 500 and MSCI World indices.
As a constituent in our SMART Fossil Fuel Free Models, the GMO Quality Strategy has a history of providing strong returns with less risk and meaningful downside protection relative to broad market equity indices. GMO integrates ESG (environmental, social, and governance) factors in both Quality assessment and valuation modelling.

As of 12/31/20 – Source: Bloomberg
What is the Definition of a Quality Company?
A Quality company generates high and sustainable return on capital. Key attributes include:
- Identifiable, high returning assets
- Long-term durability of the business model
- Management that invests prudently with a long horizon
The GMO ESG Dashboard: Quality Strategy
The Quality Strategy has an overall ESG score that is better than the benchmark, particularly with respect to environmental criteria.

GMO’s final ESG score for the Quality Strategy is derived from MSCI’s ESG ratings data. It considers the industry-adjusted weighted-average key indicator scores, along with a set of portfolio adjustments that account for ratings momentum (the percent of companies trending positive/negative) and the overall ratings quality (the percent of laggards in the portfolio).
The above charts are based on a representative account in the Strategy that was selected because it has the fewest restrictions and best represents the implementation of the Strategy.

[1] https://www.gmo.com/americas/research-library/quality-investing-and-inflation/