Gitterman Asset Management logo
Gitterman Asset Management
Photograph of waves crashing against a pier

News + Insights

Spring 2024 Quarterly Market Outlook: A.I. Earnings vs. the U.S. Economy

by Adam Bernstein, ESG / Impact Analyst

Download PDF Version

And Please Join Us:
Gitterman Spring 2024 Quarterly
Market Outlook Webinar
Tuesday, April 30, 2024
3:00 – 4:00 PM ET
Register

Note: This webinar is for financial professionals only.

_________________________

Economic Update

The first quarter of 2024 was a financial tug-of-war between pessimism and optimism. Bearish economists, the dominant force in 2022 when the Bloomberg US Recession Probability Forecast stood at 65%, warned of high valuations, the instability of a narrow bull market, and pointed to the Fed’s quantitative tightening (QT) program. However, bullish voices grew stronger throughout 2023 and have moved into an even higher gear in Q1 of 2024, brought on by positive AI earnings, a Fed pivot, and continued consumer strength. This shift is highlighted by Bloomberg’s US Recession Probability Forecast, which has readjusted down to a 40% chance that a US recession will start within the next 12 months.

Last quarter, we focused on answering why economists got their 2023 bearish forecast wrong and what market dynamics let to the Fed pivot. In summary, the answers were threefold:

1) A stronger-than-expected consumer, unaffected by rate hikes due to low locked-in mortgage rates.

2) Pandemic-induced supply chain disruptions and labor shortages eased more quickly than expected, decreasing goods inflationary pressures, and avoiding the need to hike rates to a level that would bring harsh economic contractions.

3) The Federal Reserve’s commitment to a 2% inflation target and quick action prevented a wage-price feedback loop from forming, helping to get quit rates back down to pre-pandemic levels, which ultimately helped hold the line on wage inflation.

This quarter, I think it’s more helpful to discuss why QT has not had its usual effect on markets and explore what its impact on consumers, banks, and companies has actually been. Understanding this market narrative and how it is changing will help investors understand the growing chasm of economic and market opinion.

Everyone expected that the raising interest rates would harm consumers, firms, and banks. This happened to a certain extent, but it only affected consumers and businesses with the most debt burden and has only affected certain parts of the economy thus far. So, we went through 2023 without having the expected hard landing. Rising rates have dampened growth and inflation, but the impact has just not been significant enough from a macro perspective to slow the broader economy sufficiently to see any of the bearish investment theses play out.

Let’s first unpack the results of the Fed’s quantitative tightening campaign thus far. Delinquency rates on credit cards have been rising, especially with people in their 20s-30s who have fallen behind since the Fed began its hiking campaign. Younger households bear the brunt of this contraction because they typically have lower incomes, higher debt burdens, and lower FICO scores. The older demographics control more of the wealth. Hence, financial stress in these groups has more of an effect on the economy, and today, we are just starting to see credit card delinquencies rise at or above their pandemic stress levels. Our latest data is from Q4 2023, and it shows that consumer housing and non-housing debts are up, standing at $17.50 trillion, and have increased by $3.4 trillion since the end of 2019.

Source: New York Fed/ Equifax / Apollo Global Management. As of Q1 2024.

Auto loan data shows us that all age groups are falling behind at a faster pace at paying back their auto loans than they did in the pandemic, and we are close to the level of auto loan delinquencies that we saw in 2008 for the 18-39 age group. This is surprising because the unemployment rate is only 3.9% today, but delinquencies have shot up similarly to when the unemployment rate was ~10% in 2008. Unsurprisingly, when you have an unemployment rate near 10%, and people are losing their jobs, they would stop paying their bills. But what is unique today is that before anyone has lost their job, with non-farm payrolls and hourly earnings above expectations, more and more people are still falling behind on paying bills.

Source: New York Fed/ Equifax / Apollo Global Management. As of Q1 2024.

A similar pattern played out in consumer savings. The chart below shows us what people have in checking and savings accounts. Lower-income households are already out of the excess savings they built up in the pandemic from stimulus checks, increased unemployment benefits, childcare tax credits, and PPP loans. This pattern carries over through the middle income (70K a year in the US) group and up to the 60-80 percentile by income group. As we reach the top 20% of income households, which accounts for ~40% of consumer spending, we still have excess savings. These households on the right of the chart still support consumption (buying tickets for concerts, sporting events, traveling, hotels, restaurants, airlines, etc.).

We still see significant savings and spending tailwinds in these pockets of the population. This group also tends to account for more of the trading volume and assets in the stock market, so when we get market rallies, it creates a feedback loop that provides a tailwind to consumer spending. Low unemployment has also boosted consumer spending support across the wealth spectrum supporting the overall economy.

Source: New York Fed/ Apollo Global Management. As of Q1 2024.

What we’ve seen from this rate hiking experience is what we would have expected: more indebted consumers and young households were affected disproportionately, while the market rally and savings cushions have more positively impacted the consumers who own assets. Because the wealth gap has gotten so wide in the US, different consumer pockets have dramatically different experiences, making it hard to interpret aggregate economic data.

When we look at companies, many of the same dynamics play out. When interest rates go up, the companies with more debt on their balance sheet get hurt. The chart shows the default rate for loan and high yield (HY) issuing corporates. As you can see, default rates have increased since rates started rising, and it is not surprising that it has mostly been companies with higher debt burdens or firms with lower coverage ratios (firms with lower revenues relative to their interest expense) who have been harder hit. Most investors have not felt these defaults in their fixed-income allocations because they have been contained to companies rated as High-yielding (HY) with a credit rating of CCC and below.

The total size of the investment grade (IG) corporate bond market is ~ $9 trillion, while the HY and loan markets are both about ~ $1 trillion each (15% of the fixed income market), so for most fixed income assets, high rates have not meaningfully affected defaults. To put this into an employment perspective, if you add up the employment figures for HY and loan issuing companies, you would find that they account for ~19 million jobs in the US economy, which is ~10% of the total ~160 million jobs that make up full employment in the U.S.

Source: Apollo Global Management. As of 02/24.

The trends we’ve explored in the labor market and among corporate delinquencies also hold for banks. This chart shows us the loans and leases of banks broken down into large (1-25th by assets) and small (26-5000th by assets) categories, and it shows us what’s happening with lending to consumers, corporates, and real estate.  When the Fed began to raise interest rates, large banks immediately hit the brakes to curb lending, while small banks took some time to hit their peak, culminating with the SVB distressed sale. However, since the regional bank crisis, all banks have been slowing their lending precipitously, despite the loose economic conditions.

Source: New York Fed / Apollo Global Management. As of Q1 2024.

Across the economy we are seeing the lagged effects of QT in markets, and rate hikes impact consumers and businesses with more debt. Still, the net effect needs to be more meaningful to tame equity markets propelled by strong earnings momentum. So why have rate hikes had less of an impact than the market and Fed expected? It’s because a lot of consumers and companies locked in low-interest debt before rate hikes took off. Households in 2020-2021 locked in 30-year 3-4% mortgages, so rates going up didn’t have the same transmission mechanism into the economy as they have in years passed. It was the same story for companies: IG issuers locked in low rates on their debt before rates rose, and thanks to a vast majority of IG being fixed rate debt. Another reason the increase in corporate default rates has not led to higher unemployment yet is because companies have been exchanging debt for equity when trying to raise money or pay expenses. When rates increase concurrently with the stock market, companies can issue equity more cheaply than debt. Companies don’t necessarily need to increase their leverage at higher rates. Evidence of this can be seen in distressed exchanges as the share of levered loan defaults has risen from 10% in 2020 to 50% today as companies shift their capital structure over towards equity.

Now that we’ve taken stock of where QT has gotten us, let’s dig into the underpinnings of what is driving the secular bull market we are in. It started with the Fed pivot in September 2023. This chart shows the FOMC member’s forecasts for what they thought the Fed Funds rate would be at different points in time by the end of this year. If we look to the left side of the chart, the dots (each dot represents an individual FOMC voting member) say that the FOMC got together in September of 2021, and they forecasted at the time that the Fed funds rate at the end of 2024 would be 2%. Obviously, for every meeting afterward, they came together and said, wait, we are wrong; rates must be higher to combat inflation. They did this until September 2023. This is the meeting where they decided interest rates were sufficiently restrictive and pivoted to expected cuts, a huge game changer for financial markets. From 2021-2023, investors have been sitting on the sidelines because it is difficult to fight the Fed and invest when rates are skyrocketing. Since this pivot, there has been a resurgence of IPOs, M&A activity, and private equity exists that were delayed during rate hikes, but this all changed in September 2023. Since then, we have seen a tremendous rally in the stock market, credit spread tightening, and financial conditions have eased materially.

Source: Bloomberg as of 3/31/24.

There are many ways to measure financial conditions, but the simplest way is to look at the Bloomberg Financial Conditions Index. The index shows that financial conditions have eased, and it’s reasonable to be concerned that there are some upside growth risks to watch out for over the coming months. Recent economic data has backed up this theory. Non-farm payrolls were quite strong in January and February, and initial jobless claims were below pre-pandemic levels.

Outside of the Fed pivot and robust AI earnings performance, another reason for this unexpected exuberance in financial conditions can be credited to increasing liquidity conditions. In QT cycles, liquidity typically decreases as the Fed takes money out of the market by selling down its balance sheet, raises interest rates, and contracts bank lending which typically all bring down overall liquidity conditions as a symptom of financial tightening. In this QT cycle, liquidity and financial conditions have both improved dramatically. I think the reason for this phenomenon is the unwinding of the Reverse Repo Asset (RRP) war chest that Powel built up during the pandemic and the Bank Term Funding Program (BTFP) that the Fed deployed to backstop reginal banks during their crisis. The RRP has been unwinding $2.2 trillion in assets at a clip of about ~$200 billion a month and is expected to be completely unwound sometime in April, while the BTFP stopped making new loans on March 11. Since 2008, our economy has become increasingly dependent on central bank liquidity, after years of QE, TARP programs, and money printing, which has trained investors to not fight the Fed. With these two major sources of excess liquidity gone, and with rates still at elevated levels, a much higher burden is now placed on corporate earnings to maintain the current market momentum.

So, what does this mean for inflation? If we have a new tailwind for Capex spending, consumer spending, and the corporate sector because of the Fed turning dovish, it does not bode well for inflation. The Headline CPI (Orange), Core CPI (Red), and Supercore CPI (Red) are the simplest ways to see if the Fed is on track with its goal.  Headline CPI went up a lot in the pandemic because we were sitting at home buying stuff online, and the supply chains couldn’t deliver, so goods inflation shot up ~12%. Once we came out of the pandemic, we had a significant burst in service inflation from the pent-up demand, which materialized in higher airline prices, restaurant prices, sporting event and entertainment services, and hotels across the board. This trend has begun to reverse as well, but remains sticky. As you can see from the chart, the critical issue is that we need to be at the Fed’s 2% inflation target. So, we can look at this chart and see the considerable progress we’ve made on inflation from 2022-2023, but let’s be honest: inflation has moved sideways for the better part of the last year, which is a big problem for the Fed. If you focus on the short-term inflation of the past three and six months, momentum is beginning to move against the Fed.

Source: Bloomberg. Data as of 3/31/24.

If you are the Fed and you look at this chart, it’s become a lot harder for you to cut interest rates. The real-time inflation is beginning to rise again, which will be a challenge for the Fed. This is why some FOMC members are walking back their cut projections and project fewer cuts.

The bottom line is if we are now seeing a tailwind to the economy coming from a strong stock market, tight credit spreads, and wealth creation from the stock market, it doesn’t take much to go to the conclusion that it might take longer to see signs again that inflation is moving back down. The last mile on inflation also seems to be tied to the market rally, meaning we might need to see a sell-off to reverse some of these trends, which is not a popular opinion amongst market participants.

So why did high rates hurt markets in 2022 but not in 2023? In 2022, the market did not like rates moving upwards and equities sold off, but what changed about 2023 was that we had this new story of AI earnings and a productivity boost that was making a significant difference in the global economy, and that suddenly became a huge boosting factor to the outlook of the stock market. This provided a significant tailwind to the Magnificent Seven and S&P 500, which rallied the market but made it more difficult for the Fed to bring down inflation, skewing the risks in the short term to the upside. They may have made a mistake in pivoting as early as they did. Previous rate cycles saw the Fed raise rates to 2x-3x trend CPI inflation. Under Chair Powell, the Fed has only raised rates 1.5x. This is partly to blame for why risk assets have been rallying aggressively. Overall, the new force propelling easing is more powerful for now than the forces propelling QT and will boost consumer spending, retail sales, and capex spending, which will drive short-term equity performance and economic growth. Although with liquidity conditions set to reverse, markets will likely become unmoored from their steady climb upwards, add volatility back into the mix, and cause investors to focus more on the tail risks that led to a sell-off in 2022.

Market Update

Before the Fed pivoted, the big question on investors’ minds was the debate around deciding whether to buy stocks or bonds. Now, post-Fed pivot, the question investors have to ask is, what am I getting if buy stocks? Buying most major indices today means buying large allocations to the Magnificent 7, which have driven returns dramatically since the beginning of last year. Since the start of 2023, The Mag 7 have returned a cumulative ~142%, and since 2024, they have delivered ~17%. The basket of stocks has trailing P/E ratios that are, on average, 35-50x; on a trailing basis, earnings might be good in the future, but these valuation levels should give you pause, with the Mag 7 making up ~35% of the index. Now, buying into the market means you are no longer just buying stocks, but we have to decide between purchasing the AI story represented by the Mag 7. That’s the homework that’s become much more challenging for investors. Another way to look at the S&P 500 is through the lens of forward P/E ratios. The chart below shows that the current AI bubble, when using 12-month forward P/Es, is larger than the Dotcom bubble in the 1990s.

Source: Apollo Global Management. As of Q1 2024.

What is the investment thesis for AI?

The recent surge in US productivity presents a compelling backdrop for evaluating the investment thesis for Artificial Intelligence (AI) companies. The hope is that AI will significantly increase productivity per worker, as major technological innovations have done in the past, allowing companies to create more value with less. Depending on how you view the future of work, this change might bring about heightened prosperity and a better work-life balance, with workers able to complete a week’s work in a few days. If you have a more pessimistic outlook, it could cause heightened unemployment as the workforce re-tools to more needed skills after automation eliminates specific jobs and accelerates inequality. Business owners hoard increased profits without allowing improved overall prosperity.

Some historical precedents support the pessimistic view, as detailed in the graph below by the Productivity-Compensation Gap. Since the 1970s in the U.S., cumulative labor productivity has grown faster than real hourly compensation. This suggests that workers haven’t fully shared in the gains from increased productivity. The relationship between cumulative labor productivity and real hourly compensation over time is complex. This gap exists because of globalization, where increased competition from foreign workers can put downward pressure on wages in the U.S. Technological advancements led to job losses and changes in labor policies and unionization rates. Policies that could close this gap have been at the heart of modern political debates around increased minimum wage, unionization, employee-sponsored training and educational advancement opportunities, progressive taxation, and universal basic income.

Source: FRED economic database. Data as of 3/31/24.

If we look at a non-cumulative chart of productivity, we can see that workers do not just become more productive over time, there must be a catalyst, and productivity doesn’t just trend upward; there are periods of significant decline. The two big candle sticks of productivity growth that we can see in the chart below occurred from 1947-1973. During that time, a raft of innovations took place, which included electrification, the internal combustion engine, telecommunications and mass media, and sanitation and medical improvements. It was not until 2001-2007, with the advent and mainstreaming of modern computing and the internet, that productivity increases matched those of the 1970s.

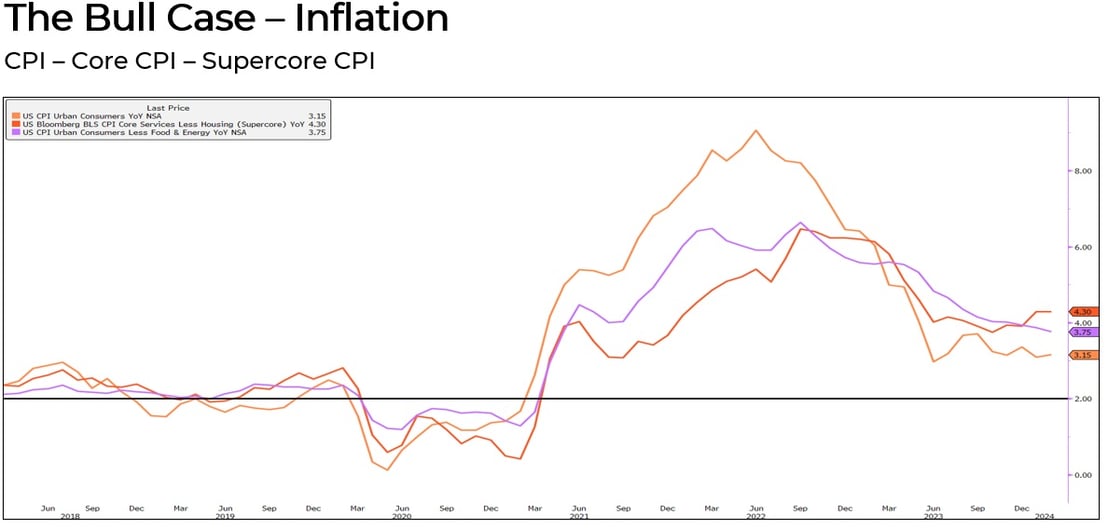
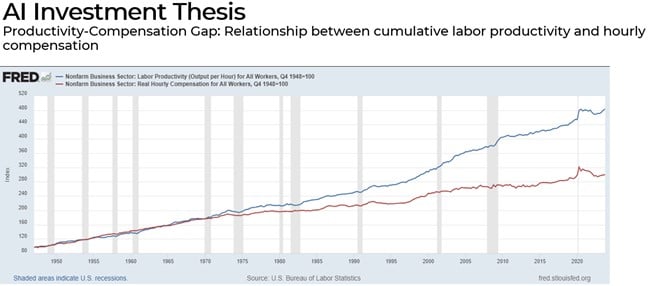
Source: US Bureau of Labor Statistics. Data as of 3/7/24.

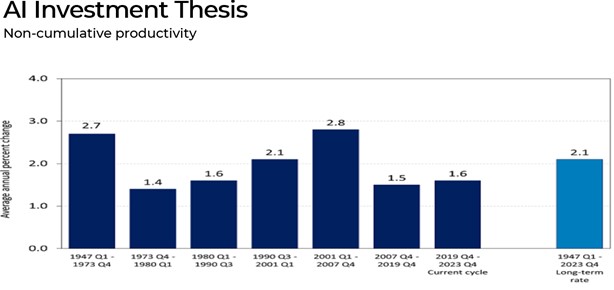
It is also worth noting the timeline around technological innovation and an ensuing surge in productivity. Not all innovations positively transform daily life. Economic historian Robert C. Allen dubbed this effect Engels’ pause; a productivity-enhancing technological innovation first displays an apparent drop in productivity growth because realizing their potential also requires significant investments and a fundamental rethinking of organizations. The Productivity J-Curve that Engels’ pause suggests should make investors wary of early successes in introducing AI into business. Productivity growth has averaged 3.9% in the last three quarters, more than triple the rate in the decade before the pandemic. When workers are more efficient, firms can generate more money to raise wages without charging higher prices so that monetary policy can be less concerned about inflation. While Wall Street has been focused on how artificial intelligence and innovations such as ChatGPT will drive efficiencies, lifting technology stocks to record highs, the 2023 boom has resulted from more mundane factors. One is an economy at full employment, with workers gaining experience and skills. According to Employ America, another element is investments from Joe Biden’s administration in plants and semiconductors, as well as spending from the Inflation Reduction Act. The Fed’s official forecasts share that conservatism, predicting long-term growth of around 2%, suggests a productivity rate of around 1.5% with a labor force growth of around 0.5%. Jay Powell said that’s probably still being affected by the pandemic, and it may well be that when all is said and done, productivity growth shakes out after the pandemic and more or less at the pace it was before the pandemic, which is closer to 1 to 1.5%. A step up in productivity could lead to a “roaring 2020s” for economic growth, said Ed Yardeni, president and founder of Yardeni Research. He estimates that productivity might increase 2.5% or more annually for the rest of the decade, much faster than the Fed’s estimates.

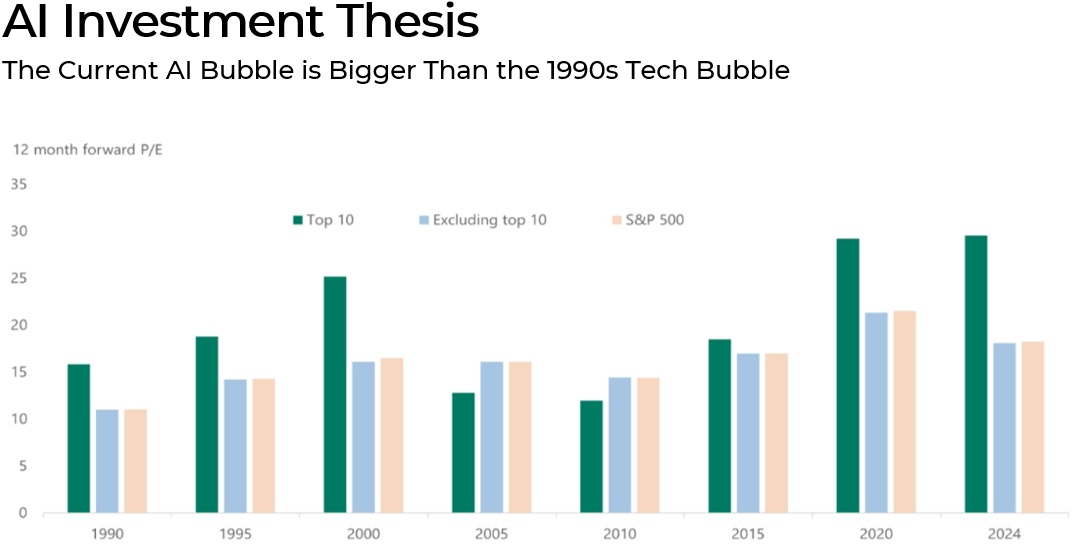
To see what needs to happen for AI to spill over all economic sectors, one can look at the extent to which S&P 500 companies invest in the future through their capex effort, measured as the capex/sales ratio. If AI is the future, like the internet was in the early 2000s, the capex to sales ratio was significantly higher than now, even after considering all the investment from the CHIPS Act aimed at catalyzing semiconductor infrastructure spending. For the productivity thesis to play out, corporate America should be making a much higher capex “effort” than it’s making today.

Resource constraints

The semiconductor and data center development landscapes are experiencing a rapid evolution characterized by a surge in construction and investment. Deutsche Bank Research highlights the initiation of 18 new chipmaking facilities between 2021 and 2023, while the Semiconductor Industry Association notes over 50 new semiconductor ecosystem projects announced in response to the CHIPS Act. This legislative initiative injected $53 billion of public funds, sparking an additional $166 billion in private investment within the semiconductor ecosystem. Forecasts indicate that major tech companies are poised to funnel $1 trillion into this sector over the next five years, primarily toward data centers. The United States is witnessing a semiconductor manufacturing boom driven by efforts to bolster domestic production and mitigate supply shortages. Industrial Info Resources monitors over $300 billion worth of active semiconductor projects at various stages of development, underscoring the sector’s momentum. New York, Arizona, Texas, and Virginia have become primary beneficiaries of recent semiconductor and data center expansion, attracting significant investment. The proliferation of AI is reshaping both digital landscapes and physical infrastructures. According to the Synergy Research Group, the global count of “hyperscale” data centers doubled from 2015 to 2020, with nearly 40 percent located in the United States and predominantly owned by industry giants like Amazon, Google, and Microsoft. Additionally, the U.S. hosts approximately 1,800 “colocation” data centers, albeit smaller in scale yet resource-intensive due to diverse operational requirements. Understanding the growth trajectory and the geographic distribution of AI infrastructure sets the stage for examining looming resource constraints. While AI models’ carbon footprint and energy consumption, like GPT-3, have drawn public attention, the significant water footprint remains largely overlooked. Addressing these challenges will be crucial to sustaining the industry’s projected growth trajectory and mitigating environmental impacts, thus aligning technological advancement with broader sustainability goals.

Energy

The recent acknowledgment by OpenAI’s CEO, Sam Altman, at the World Economic Forum in Davos signals a sobering reality for the artificial intelligence (AI) industry, an impending energy crisis. Altman’s warning underscores the exponential energy demands of forthcoming generative AI systems, which are anticipated to surpass conventional estimates. Generative AI-driven searches, for instance, are projected to consume four to five times more energy than traditional web searches, exacerbating the strain on energy systems. The energy-intensive nature of AI operations, notably within hyperscalers like Meta, Amazon.com, Microsoft, and Google, has led to a threefold surge in energy consumption since 2018. While these companies have made strides in adopting renewable energy, such efforts will compete with emerging clean technologies like electric vehicles (EVs) and hydrogen for energy consumption needs. Data center energy needs are projected to triple by 2030, reaching 5% of global demand without substantial efficiency enhancements.

The push for electrification as a climate-friendly strategy faces its own challenges, particularly regarding meeting clean-energy targets amidst escalating demands from AI and EVs. Although AI promises environmental benefits such as predictive maintenance and real-time energy-consumption analysis, the surge will still strain the grid and threaten to worsen the climate crisis. The proliferation of data centers, exemplified by Amazon’s expansive infrastructure in northern Virginia, underscores the scale of energy consumption. Amazon’s 102 data centers, equipped with emergency generators in Virgina alone are capable of producing over 4.6 gigawatts of power (almost enough energy to power NYC for a day), highlight the immense strain on energy grids. Training AI models like GPT-3 further exacerbates energy demands, with estimates revealing significant emissions and electricity consumption for model training.

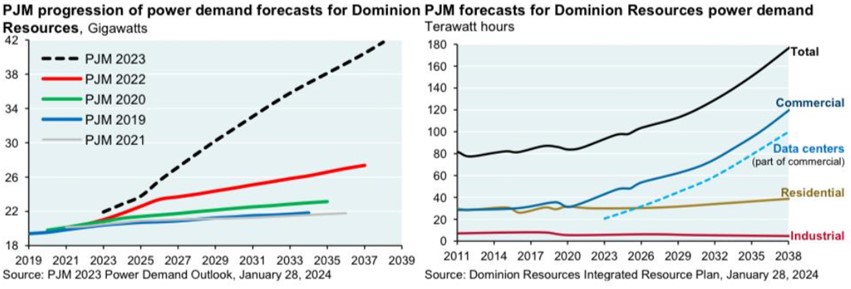
The confluence of AI and EV growth strains existing energy infrastructure, heightening the risk of grid failures without substantial increases in energy production that can handle peak demand flareups. While renewables show promise, current output and storage capacities are insufficient to meet escalating demands, precluding a return to traditional-based energy production. Nuclear energy has emerged as a viable option due to its capacity and base load utilization potential, albeit hindered by political challenges in the U.S. This underscores the urgent need for comprehensive energy strategies to support the burgeoning AI industry while mitigating environmental impacts sustainably. The below image illustrates the power demand forecast of the Pennsylvania, Jersey, Maryland Interconnection (PJM), a regional transmission organization that coordinates the movement of wholesale electricity to a large portion of the East coast, for a specific utility, in this case Dominion Resources. Clearly you can see the expectations for data center energy consumption for grid operators and utilities.

Water

Water engulfs 71% of our Earth. However, 97% of it is trapped in the salty embrace of the oceans, leaving us with a mere 3% freshwater. Of that, 2.5% is locked away as ice, leaving a mere 0.5% of accessible freshwater for human consumption. The water industry has quickly become an asset class, which encompasses many aspects related to water supply, distribution, treatment, and management. Regions such as NYC and Chicago rely on extensive infrastructure to transport water long distances. However, the landscape is evolving, with the proliferation of data centers posing significant challenges. These facilities, integral to the digital age, exhibit voracious water consumption, with the typical data center using about 3-5 million gallons of water per day, the same amount of daily water consumption as a city of 30,000-50,000 people. As the global demand for artificial intelligence (AI) escalates, so does its water intensity, with projections suggesting AI will account for 4.2–6.6 billion cubic meters of water withdrawal by 2027, which is more than the total annual water withdrawal of 4–6 Denmark’s or half of the United Kingdom.

The allure of water-scarce regions in the Western United States has attracted many data center operators, enticed by the availability of renewable energy sources like solar and wind. According to researchers at Virginia Tech, approximately one-fifth of data centers draw water from moderately to highly stressed watersheds, predominantly in the Western U.S. This trend underscores the intricate interplay between water availability, energy resources, and data center location decisions, influenced by factors such as infrastructure proximity, land cost, tax incentives, and electricity access. In Mesa, Arizona, Google secured approval for a data center project, leveraging guarantees from the local Arizona Municipal Water Users Association for substantial water supplies. Despite attempts to shield its water usage as a proprietary trade secret, Google’s substantial water consumption has occasionally surfaced through legal disputes with utilities and conservation groups. In 2019 alone, Google obtained over 2.3 billion gallons of water for its data centers across three states, exemplifying the magnitude of its water demands.

Similarly, Google’s planned data center in Red Oak, Texas, necessitates a significant water allocation, prompting a petition to strip a local utility of its sole supplier status for the region, due to capacity constraints it tried to levy on Google. This development marks Google’s second major data center project in Texas, highlighting the company’s expanding footprint in water-stressed regions. Such expansions have spurred controversies in Berkeley County, South Carolina, where environmental groups contested Google’s groundwater extraction plans, exacerbating tensions over water resource management amidst growing demands from data center operations. These instances underscore the growing nexus between data center expansion, water resource utilization, and environmental stewardship. Notably, while municipalities like Red Oak grapple with depleting water sources, they urge residents to reduce consumption, even as large-scale users like Google are granted significant water allocations. This disparity illustrates the complex challenges of water resource management in the face of burgeoning technological advancements.

_____________________________________

Gitterman Wealth Management, LLC dba Gitterman Asset Management. Services provided by Gitterman Asset Management are provided by Gitterman Wealth Management, LLC. All investment advisory services are offered solely through Gitterman Wealth Management, LLC an independent investment advisory firm registered with the SEC (CRD 153062). Associated persons of Gitterman Wealth Management, LLC are licensed with and offer securities through Vanderbilt Securities, LLC, member FINRA/SIPC, registered with MSRB (CRD 5953). Gitterman Wealth Management, LLC and Vanderbilt Securities, LLC are separate and distinct federally regulated entities. For more information see www.adviserinfo.sec.gov
The asset allocation of the model portfolios listed above are proprietary to and developed by GWM. Different types of investments and strategies involve varying degrees of risk, and there can be no assurance that any specific investment or strategy will be profitable. It is important for Investment Advisers to review with their clients their investment objectives, risk tolerance, time horizon, liquidity needs, and tax consequences related to the strategies in this presentation at least annually. Any investment involves a high degree of risk, including the risk that the entire amount invested may be lost. Many factors affect performance including changes in market condition, changes in interest rates, and market responses to economic, political and social developments.
This document does not constitute advice or a recommendation or offer to sell or a solicitation to deal in any security or financial product. It is provided for information purposes only and on the understanding that the recipient has sufficient knowledge and experience to be able to understand and make their own evaluation of the proposals and services described herein, any risks associated therewith and any related legal, tax, accounting or other material considerations. To the extent that the reader has any questions regarding the applicability of any specific issue discussed above to their specific portfolio or situation, prospective investors are encouraged to contact Gitterman Asset Management or consult with the professional advisor of their choosing.
Certain information contained herein has been obtained from third party sources and such information has not been independently verified by Gitterman. No representation, warranty, or undertaking, expressed or implied, is given to the accuracy or completeness of such information by Gitterman or any other person. While such sources are believed to be reliable, Gitterman does not assume any responsibility for the accuracy or completeness of such information. Gitterman does not undertake any obligation to update the information contained herein as of any future date.
Gitterman Asset Management (GAM) may recommend the use of Independent Managers as part of an asset allocation model or as an independent strategy. GAM is not compensated in any way for the endorsement of any Independent Managers.
Certain information contained herein constitutes “forward-looking statements,” which can be identified by the use of forward-looking terminology such as “may,” “will,” “should,” “expect,” “anticipate,” “project,” “estimate,” “intend,” “continue,” or “believe,” or the negatives thereof or other variations thereon or comparable terminology. Due to various risks and uncertainties, actual events, results or actual performance may differ materially from those reflected or contemplated in such forward-looking statements. Nothing contained herein may be relied upon as a guarantee, promise, assurance or a representation as to the future.
The information set forth herein is intended to be informational in nature and is not intended to be, and should not be construed as, investment advice. This information is accurate as of the above-listed date and it should not be assumed that it will remain the same over time. The views within this video do not necessarily reflect the views of Gitterman Asset Management and there is no guarantee that market trends discussed will continue to come to fruition.
PRIVILEGED AND CONFIDENTIAL: This communication, including attachments, is for the exclusive use of addressee and may contain proprietary, confidential or privileged information. It is your responsibility to ensure that all proprietary, confidential or privileged information contained here-in is masked/encrypted prior to any further distribution. If you are not the intended recipient, any use, copying, disclosure, dissemination or distribution is strictly prohibited. If you’re not the intended recipient, please notify the sender immediately by return email and delete this communication and destroy all copies.